
In the world of racing, one question constantly arises: was the car’s damage due to the car being too fragile or to the dangerous nature of the track during the excursion or collision? To answer this question and quantify the true danger of a situation, we have created a new tool: the Risk Exposure Index (RII).
This unique indicator doesn’t simply assess the fragility of a vehicle or the dangerousness of a circuit in isolation. It combines these two realities into a single, powerful score that clearly shows you the true potential for “damage.” Let’s take a look at how it works and what it can teach us.
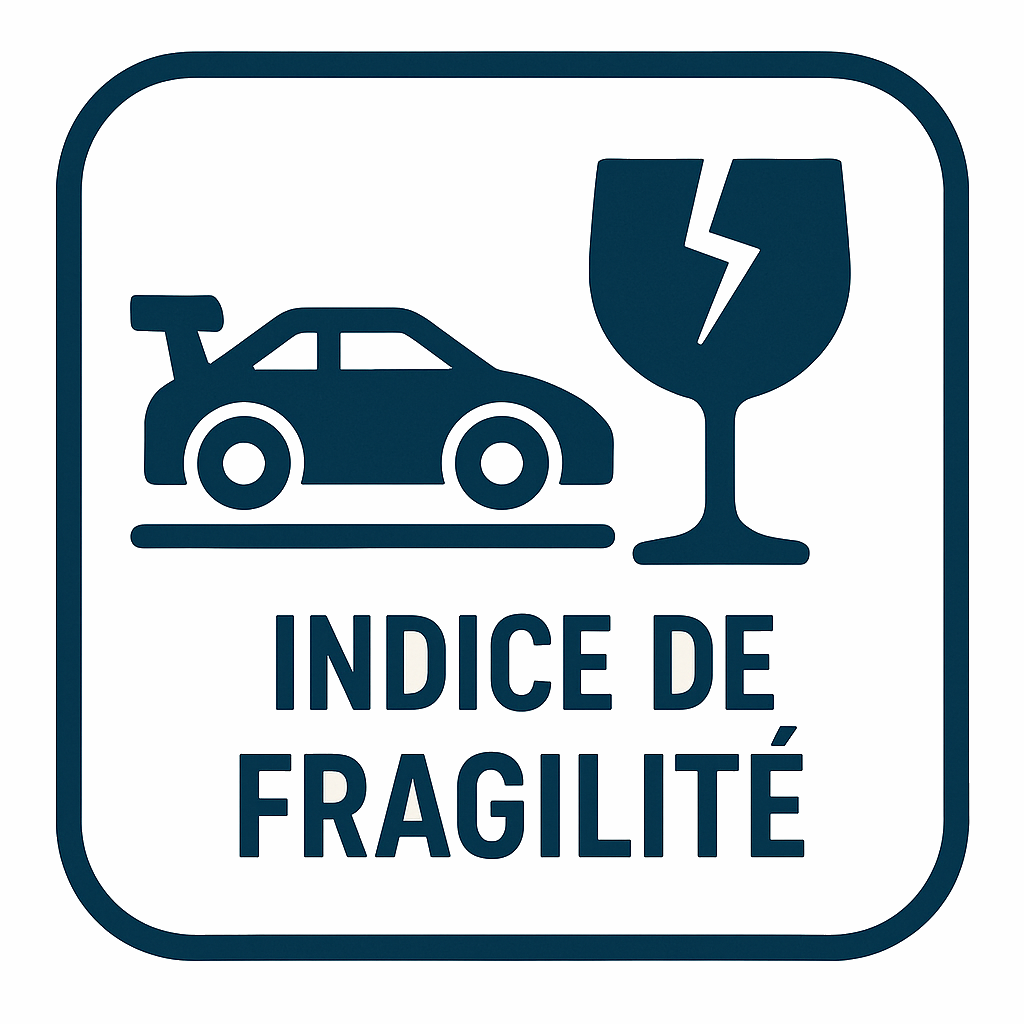
The fragility index
Quantifying a Car’s Vulnerability
Not all cars are equal when it comes to impacts. Some can withstand contact without flinching, while others lose parts at the slightest friction. To objectively measure this vulnerability, we created the Fragility Index.
The principle is simple: instead of assigning a subjective score, this index is calculated by adding the points for each fragile element of the vehicle. Each part is carefully weighted according to its size, its exposure to risk, and its importance.
A large front spoiler, crucial to performance and highly exposed, will therefore contribute much more to the score than a simple rearview mirror. Here is an example of our scale:
- Front spoiler: 4 points
- Rear spoiler: 3 points
- Rearview mirror: 1 point
- Antenna: 1 point
- Other accessories: 1 point
By adding up the points for all of a car’s components, we obtain a final score that accurately represents its level of fragility on the track.
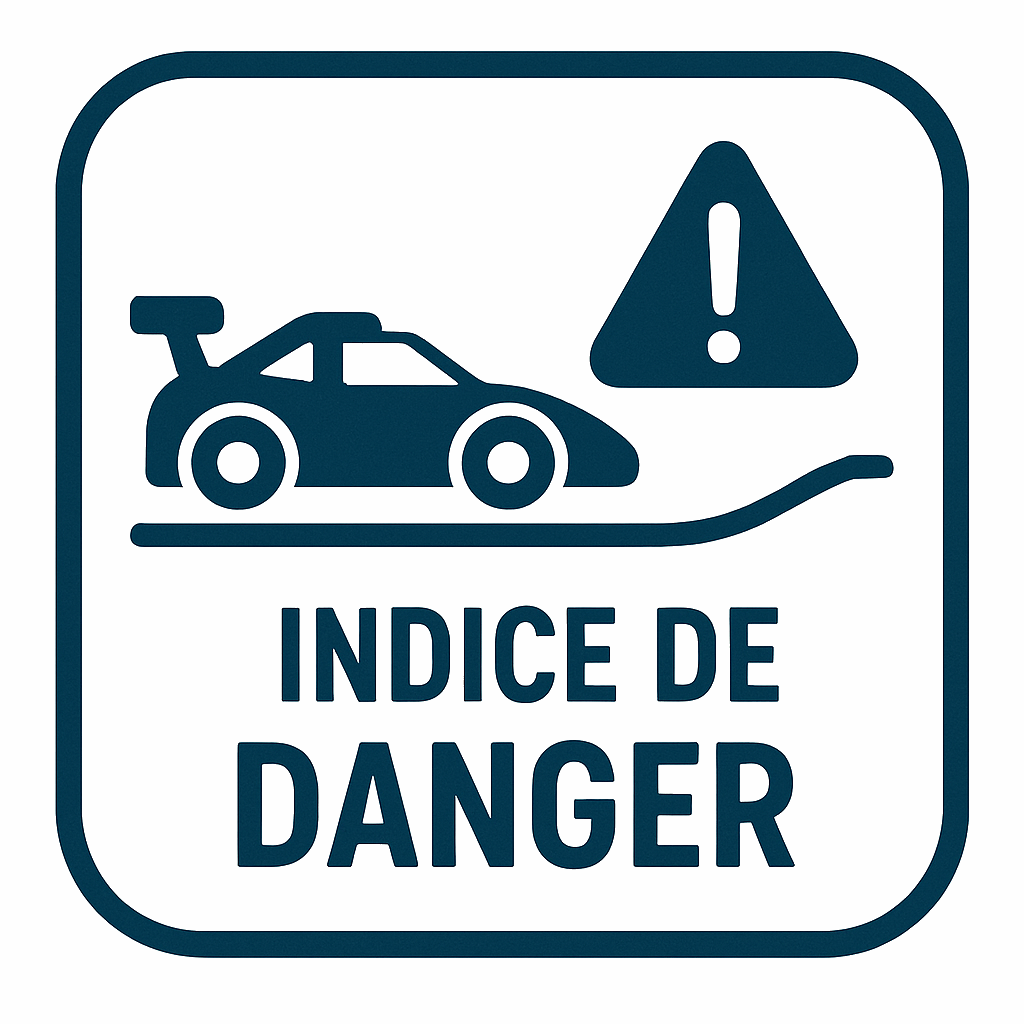
The Danger Index
Assessing the Risks of Each Circuit
What makes a circuit truly dangerous? Is it a long straight prone to braking errors, or a series of tight corners where contact is inevitable? To objectively assess and compare the danger of circuits, we developed the Danger Index.
This index is based on a methodical analysis of the circuit, in which we identify each at-risk section. Each type of obstacle or configuration is assigned points based on its potential to cause incidents. The weighting is crucial: a simple narrowing is much less dangerous than a junction where cars can collide head-on.
Our scale reflects this hierarchy of risk:
| Element | Danger points |
| 90° intersection | 4 |
| Looping | 3 |
| Lane changes on curves | 3 |
| Straight line lane changes | 3 |
| Flyover | 2 |
| Seesaw | 2 |
| Toggle | 2 |
| Straight line narrowing | 1 |
| Chicane | 1 |
| Earth elements | 1 |
| Bump | 1 |
By adding up the points for all the “hot spots” on a circuit, you get a final score. The higher this index, the more unforgiving the circuit and the greater the risk of a car breaking down!
Risk Exposure Index (IER)
Here is a description of the risk levels for the Risk Exposure Index (IER) on a racetrack, ranging from low risk to a very high risk of damage.
0 to 9 (green): Negligible risk
Your car is very strong (low fragility index) and the track is safe (low hazard index). Even in the event of an excursion, the likelihood of damage is minimal. You can focus on performance with confidence.
10 to 19 (yellow): Low risk
One of the two factors, the fragility of the car or the hazard of the track, is beginning to increase slightly. The situation remains under control, but an excursion could result in minor damage, such as scratches or easily replaceable parts.
20 to 29 (orange): Moderate risk
Both indices have a more significant impact. For example, a moderately fragile car competes on a track with few risky areas, or a more fragile car on a relatively safe track. A track exit can cause visible and potentially costly damage.
30 to 39 (red): High Risk
The combination of the two factors is alarming. The car may be fragile, and the track includes very dangerous areas. A track exit under these conditions can cause significant damage, requiring major repairs and potentially ending your session.
40 to 49 (scarlet red): Very High Risk
The danger is critical. A fragile car is driving on a notoriously dangerous track, or a moderately fragile car on an extremely dangerous track. The probability of destruction is very high. It is imperative to adjust your driving to minimize the risks and not entrust the controller to a novice.
50 and above (black): Extreme Risk
The danger is maximum. You are combining a very fragile car with an extremely dangerous track. Any mistake, even minor, will most likely result in a breakdown. It is essential to be extremely careful.
Example of circuits and vehicles
The Track Danger Index
| Reference | Name | Danger index | |
 | 62603 | Champion’s Racing | 0 |
 | 62605 | Speed Zone | 9 |
 | 62604 | Super Formula | 7 |
 | 62602 | Tuning Zone | 10 |
 | 62477 | Disney·Pixar Cars – Neon Nights | 10 |
 | 62601 | Street Legends | 3 |
The car’s fragility index
| Reference | Name | Fragility index | |
 | 64280 | Oracle Red Bull Racing RB21 “M. Verstappen, No.1” (2025) | 7 |
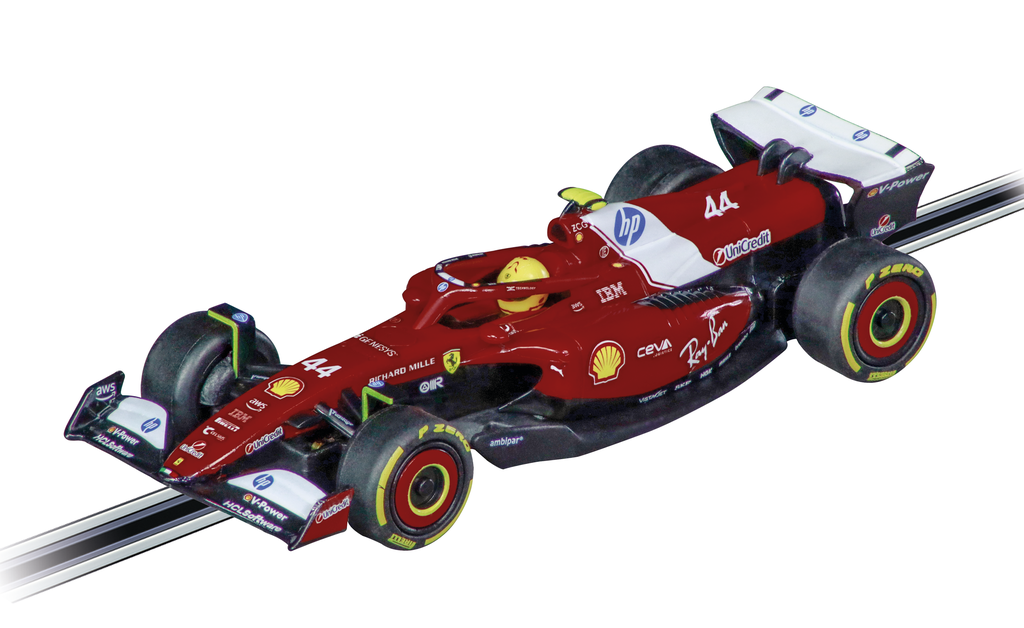 | 64282 | Ferrari SF-25 “L. Hamilton, No.44” (2025) | 7 |
 | 64287 | Hypercar Anthracite neon vert | 3 |
 | 64288 | Hypercar Anthracite neon jaune | 3 |
 | 64150 | Disney·Pixar Cars – Lightning McQueen – Neon Nights | 0 |
 | 64151 | Disney·Pixar Cars – Jackson Storm – Neon Nights | 1.5 |
 | 64289 | Ford Mustang ’67 – Stars ‘n Stripes | 1 |
 | 64290 | Chevrolet Camaro Stars ‘n Stripes | 2,5 |
Risk Exposure Index (IER)
Index 7 | Index 2.5 | Index 0 | |
62603 Index 0 | 7×0 = 0 Negligible risk | 2.5×0 = 0 Negligible risk | 0x0 = 0 Negligible risk |
62605 indice 9 | 7×9 = 63 Extreme risk | 2.5×9 = 22.5 Moderate risk | 0x9 = 0 Negligible risk |
62604 Index 7 | 7×7 = 49 Very high risk | 2.5×7 = 17.5 Moderate risk | 0x7 = 0 Negligible risk |
62602 Index 10 | 7×10 = 70 Extreme risk | 2.5×10 = 25 Moderate risk | 0x10 = 0 Negligible risk |
62477 Index 10 | 7×10 = 70 Extreme risk | 2.5×10 = 25 Moderate risk | 0x10 = 0 Negligible risk |
62601 Index 3 | 7×3 = 21 Moderate risk | 2.5×3 = 7.5 Negligible risk | 0x3 = 0 Negligible risk |
Using this method, we can see that the risk of damaging your car depends on the car itself, but also on the track. A car without any risky elements, like Lightning McQueen, is safe on all tracks. A Formula 1 car, which is very fragile, is highly dependent on the track. Note that the Risk Exposure Index is 0 for a Formula 1 car on a risk-free track, but that doesn’t mean it will never break; if you take a corner hard, the car will crash.
The indicator indicates whether you have a high or low risk, but zero risk doesn’t exist at low levels; it’s simply the lowest level.
We can see that for a medium-risk vehicle like the Chevrolet, the risk varies depending on the track.
Sometimes, replacing a dangerous element with a less dangerous one is enough to significantly reduce the risk, or even eliminate it with a straight rail.
I invite you to weigh all this against the driver’s driving skills, which will depend on their age and ability to stay on the track depending on the track’s difficulty. A good driver will be able to do more than a beginner who doesn’t know how to pace himself.
This is how we can define the Slot Experience Index (SEI)
The Slot Experience Index (SEI) is a qualitative indicator designed to assess a slot racing driver’s potential before even seeing them on track. Based solely on their self-reported experience in the hobby, the SEI classifies the driver into one of four levels: Novice, Amateur, Experienced, or Advanced. Each level is associated with a percentage reflecting an estimate of their overall aptitude, providing a quick overview of their profile and the skills they have acquired over time.
| No Experience (Novice) | Little Experience (Amateur) | Good experience (Experienced) | Huge Experience (Confirmed) | |
| confidence index (%) | 100% | 70% | 40% | 20% |
We can thus adjust the value obtained by the Risk Exposure Index (IER) to refine it, as the risk also depends on the driver.
Let’s take two examples with a high IER (49) and a medium IER (25). With a novice driver, the risk remains the same, but with an expert driver, the risk decreases drastically but is not zero, which is normal because zero risk does not exist.
| No Experience (Novice) 100% | Little Experience (Amateur) 70% | 40% | Huge Experience (Confirmed) 20% | |
62604 Index 7 Index 7 7×7 = 49 Risque très élevé | 49 | 34.3 | 19.6 | 10 |
62602 Index 10 Index 2.5 2.5×10 = 25 Risque modéré | 25 | 17.5 | 10 | 5 |
This scoring technique can only be applied to the GO range as the FIRST is not fast enough to need scoring and the 1/24 track does not really have any dangerous track elements and is aimed at beginners.
Conclusion
With this index, you can choose the right set based on its track and cars, as well as the user profile. You can also use this index to choose an additional car or modify the track to limit the risk of breakage.
Calculation summary:
Danger Index X Fragility Index = Risk Exposure Index (IER)
IER can be re-evaluated with the IES:
Danger Index X Fragility Index X Slot Experience Index (IES) = Risk Exposure Index (IER)
Get your calculators out…
Photo source: CARRERA website